
Dashboard
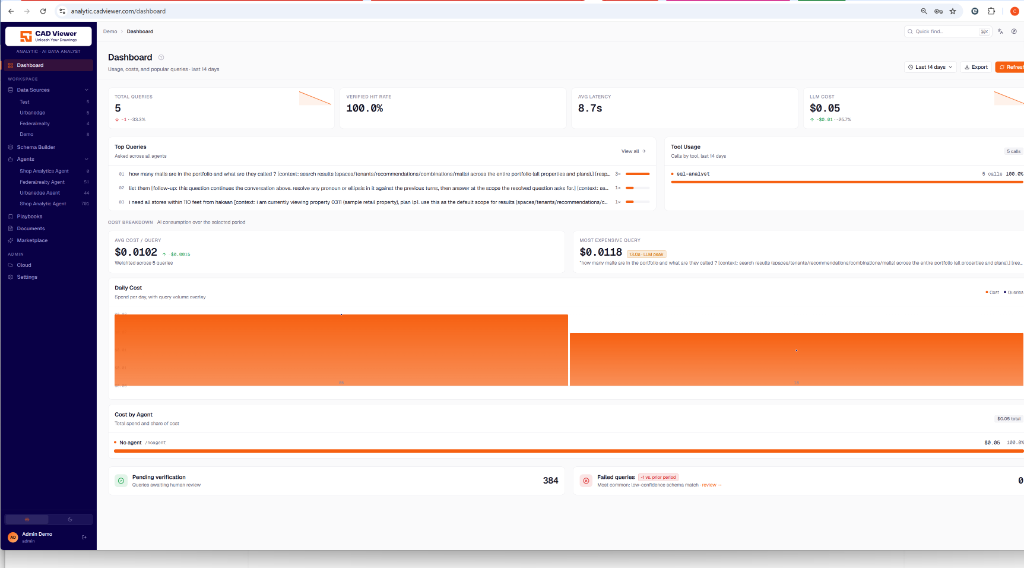
The Tenant Admin Dashboard gives organizational administrators insights into their specific workspace’s AI and system usage.
Key Features
- Total Queries & Verified Hit Rate: See how effectively the AI agent is answering user queries.
- LLM Cost & Tool Usage: Detailed breakdown of cost by agent and average latency.
- Top Queries: See the most frequent questions users are asking against the portfolio.
Your workspace
Everything you see belongs to this tenant: its data sources, agents and cloud app. The badge tells you which one you are working in — it matters when you have access to several.
Data sources
Connect the databases holding your data — Postgres, Snowflake, and so on. Everything downstream reads through them, so start here.
Describe the tables an agent may query, grouped by subject. A group is what you hand to an agent, so it only sees the tables it needs.
The assistants answering your users. An agent combines a set of tools, its prompts, and the playbooks bound to each tool.
Question/SQL pairs you have verified. The agent matches an incoming question against them before writing any SQL of its own — this is what makes answers repeatable.
Leases, policies, any text the agent should be able to quote. They are indexed and searched separately from the SQL side.
Ready-made packs: schema, sample data, verified queries and a configured agent. Installing one gives you a working setup to start from.
Provision and configure the CAD viewer your users open — its look, its options, and the drawings it serves.
Replay any time
This menu holds the guided tours. Most pages and dialogs have one of their own, reachable from the “?” next to their title.