
Front-End Dashboard
Server Management Dashboard
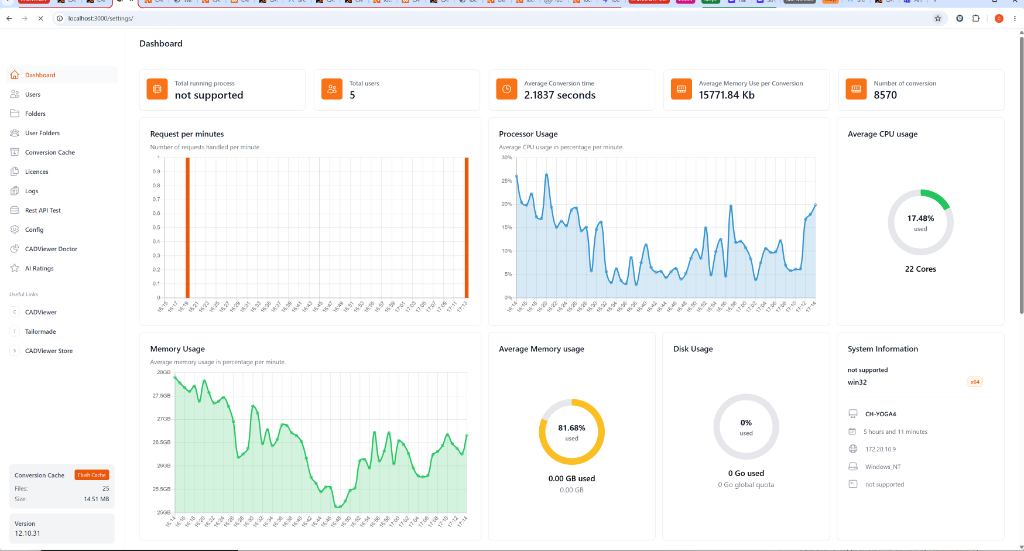
The CADViewer Conversion Server includes a powerful, graphical Front-End Dashboard. Usually accessible at http://localhost:3000/settings/ (or your configured port/URL), this dashboard gives administrators complete visibility and control over the conversion server’s operations.
Dashboard Capabilities
From the left-hand navigation menu, administrators can access a wealth of tools to manage and debug the system:
- Dashboard (Home): Monitor real-time system telemetry. This page tracks total active processes, registered users, and aggregated statistics like average conversion time (in seconds) and memory usage per conversion. It also features live-updating graphs for:
- Requests per minute
- CPU/Processor usage (percentage)
- System memory (RAM) consumption and Disk quota usage
- Host system information (OS, uptime, architecture)
- Users: Manage server users, provision accounts, and oversee authentication profiles for your tenants or staff.
- Folders & User Folders: Explore and manage physical file structures, upload directories, and segregated tenant directories for CAD files and outputs.
- Conversion Cache: Monitor the server’s cache health. You can view the current file count and total Megabytes consumed by temporary conversions, and use the handy Flush Cache button to immediately free up disk space.
- Licences: View, validate, and manage your active CADViewer and AutoXchange software licenses.
- Logs: Access detailed operational server logs. This is critical for debugging failed conversions, tracking API payloads, and auditing system behavior.
- Rest API Test: A built-in testing suite designed to fire payloads directly at the Conversion Server REST API, allowing you to validate JSON responses and server behavior directly from the GUI without needing Postman or cURL.
- Config: A visual interface to tweak, review, and apply settings normally found in the
CADViewer_config.jsonfile. - CADViewer Doctor: Diagnostic tools to verify system health. It runs checks to ensure required system fonts are installed, converter binaries are executable, and library dependencies (like
libstdc++on Linux) are satisfied. - AI Ratings: View and manage analytics/AI-based processing ratings and metrics.
This built-in administrative suite ensures that you always have a clear, top-down view of your CAD server’s performance and health.