CADViewer Redlines API
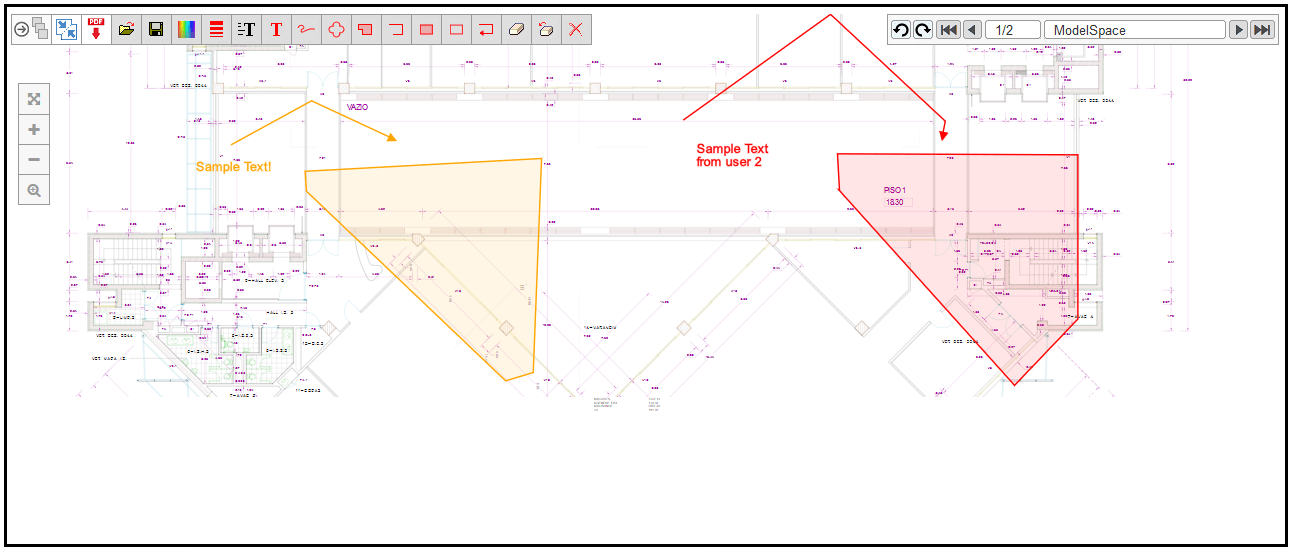
Sample for embedding CADViewer in an encapsulating application. Redline handling of features such as locked users, hidden users, etc. are all Javascript API controlled. File and redline load/save are all done through API calls
Go to Online Demo